How to Grow Your Business Online: Part 3 – Tracking & Analysis
Posted by. Disrupt Tech. February 20, 2022
This is the 3rd part of the How to Grow Your Business Online series. In part 1 and 2, we have already discussed market research and the ways to drive more customers. Today, we are going to go into the tracking and analysis process. So, let’s crush this.
In our last article, we discussed the strategies to drive more customers. You may have run different marketing campaigns already. Now, how will you know which one is working? More importantly, why the ones that are not working are not working?
The answer is in the KPIs. KPI stands for Key Performance Indicators. There are hundreds of them. So, you can’t analyze all of them.
That’s why, in this article, we have categorized the most important KPIs. Tracking and analyzing these KPIs is directly related to growing your business online. Quality over quantity in this case. So, let’ begin –
1. Lead Generation Metrics
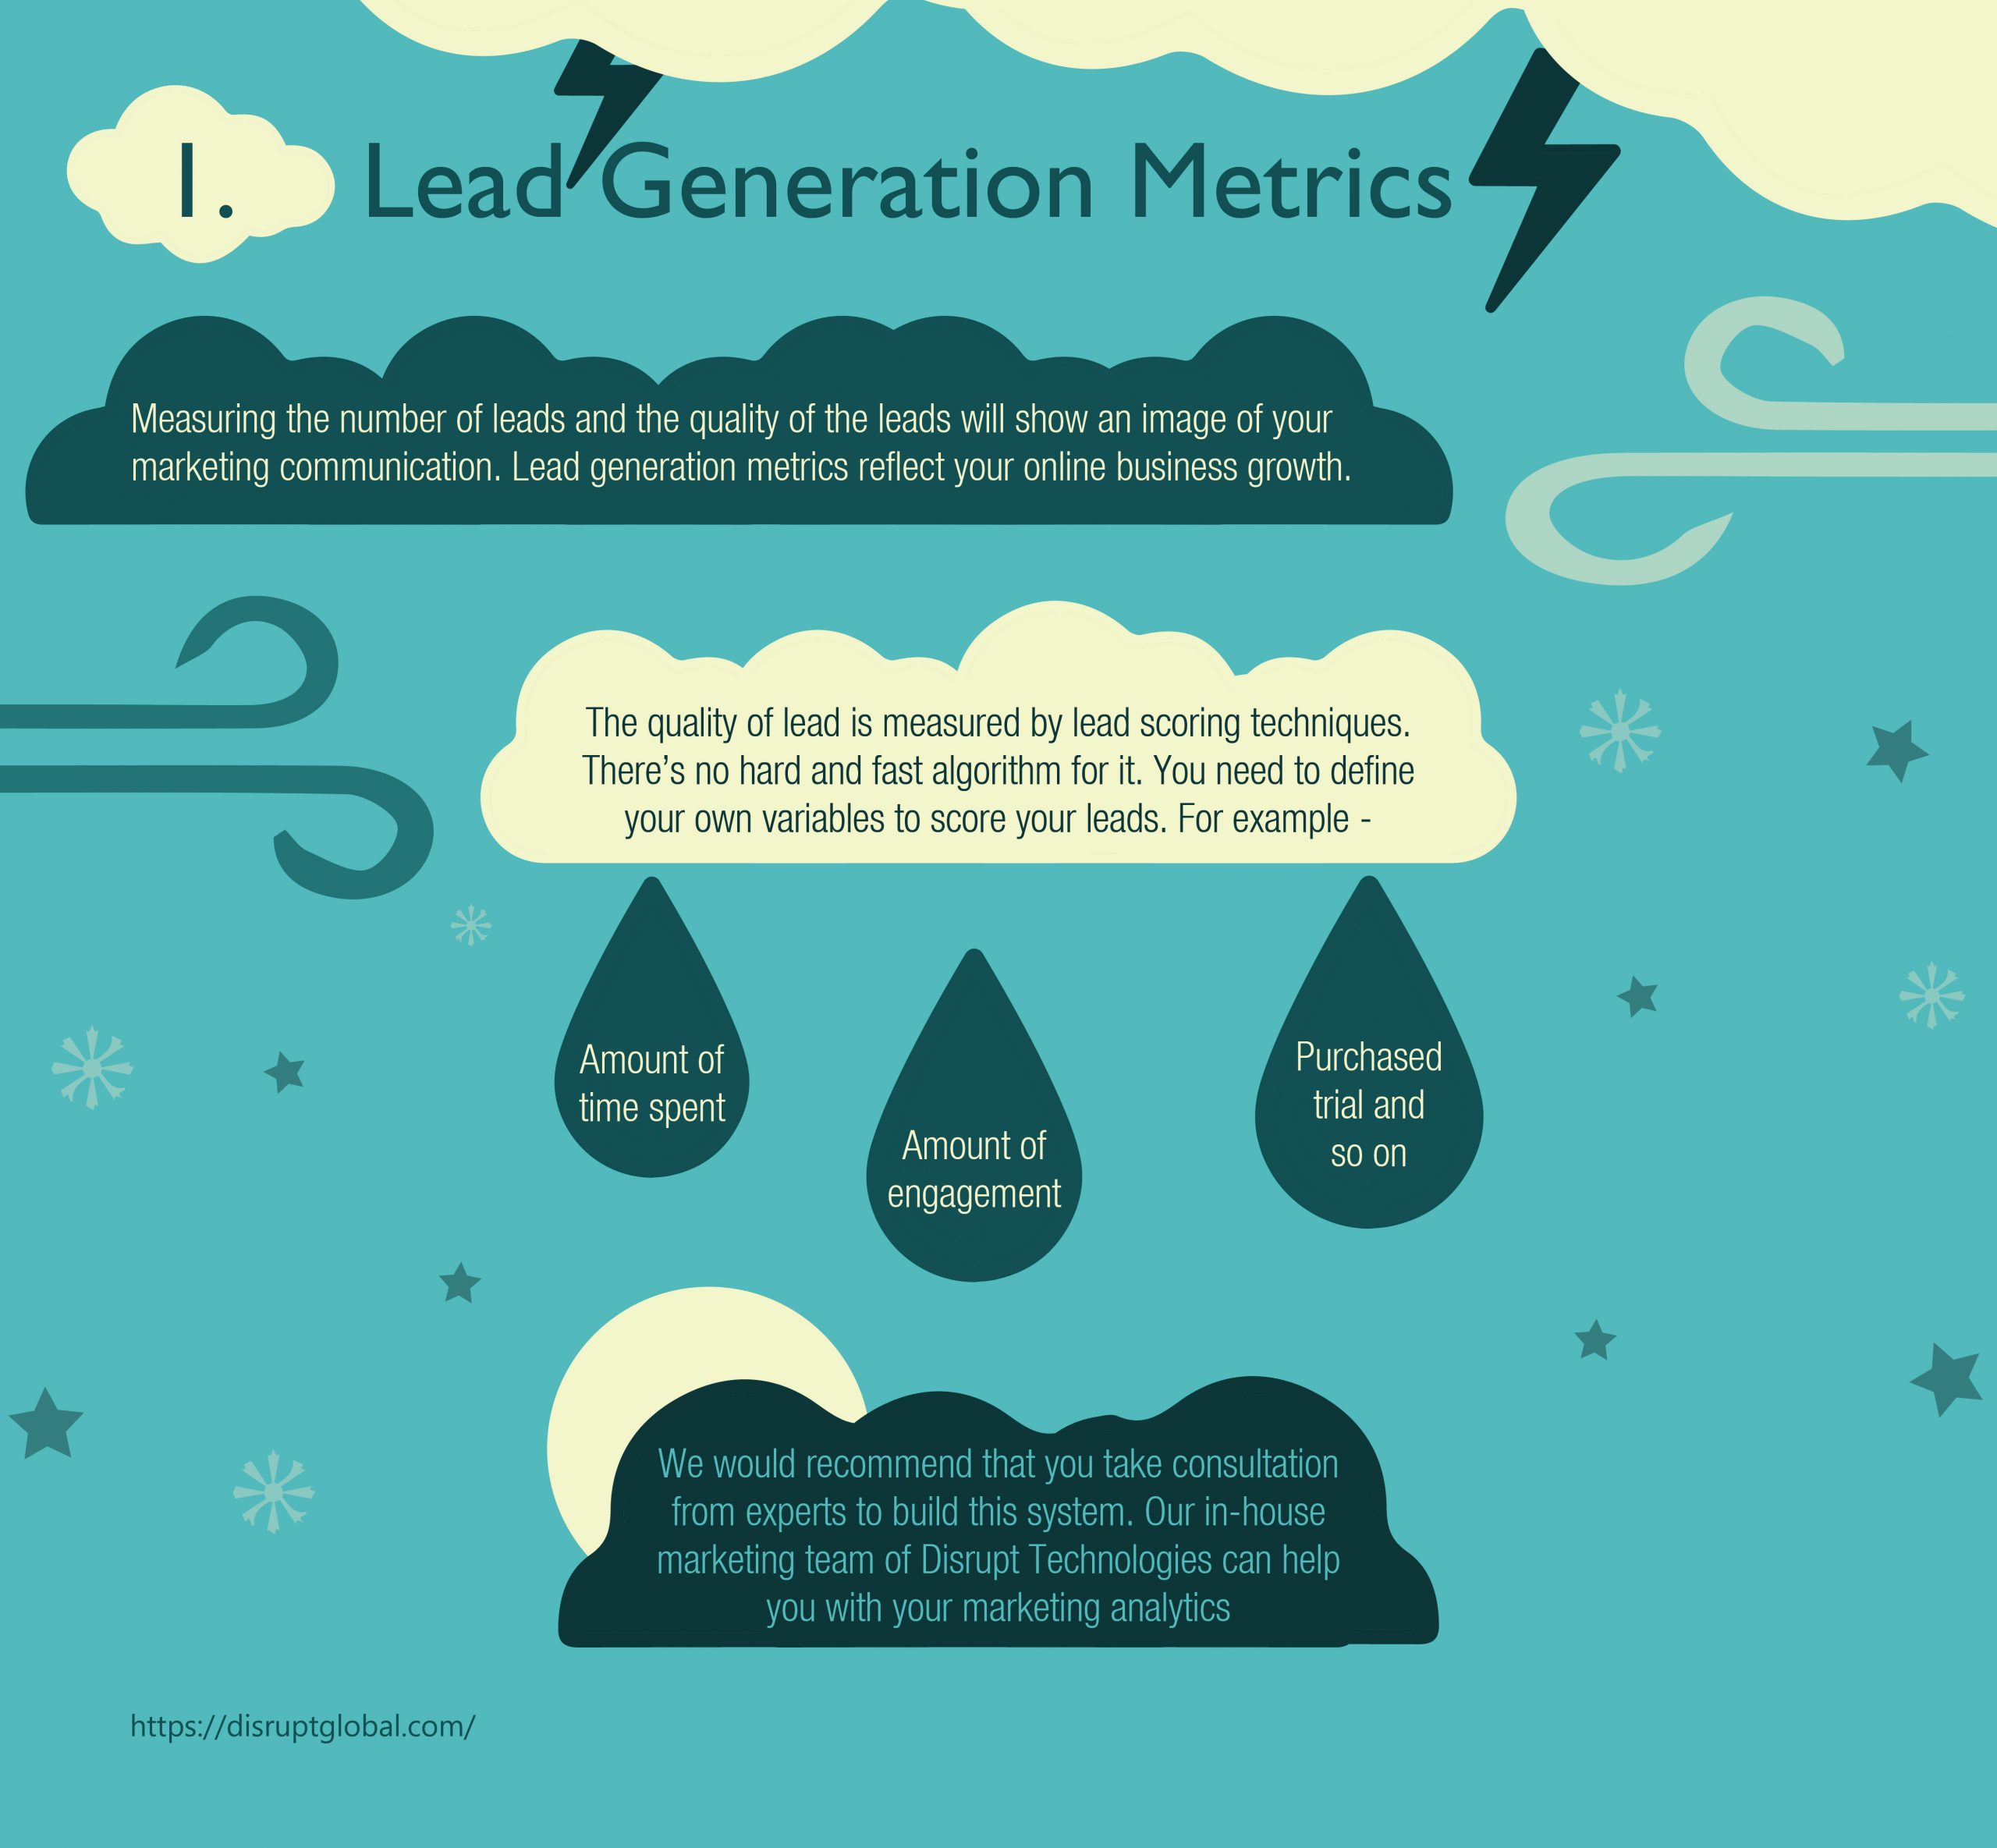
For online businesses, you should always track your lead generation metrics. Measuring the number of leads and the quality of the leads will show an image of your marketing communication. Lead generation metrics reflect your online business growth.
Now you might be thinking – “okay. I know how to get the number of leads. It’s right there in my CRM. But how to measure the quality?”
Yes, it’s a bit complex. The quality of lead is measured by lead scoring techniques. There’s no hard and fast algorithm for it. You need to define your own variables to score your leads. For example –
• Amount of time spent
• Amount of engagement
• Purchased trial and so on.
We would recommend that you take consultation from experts to build this system. Our in-house marketing team of Disrupt Technologies can help you with your marketing analytics.
2. Brand Visibility Metrics
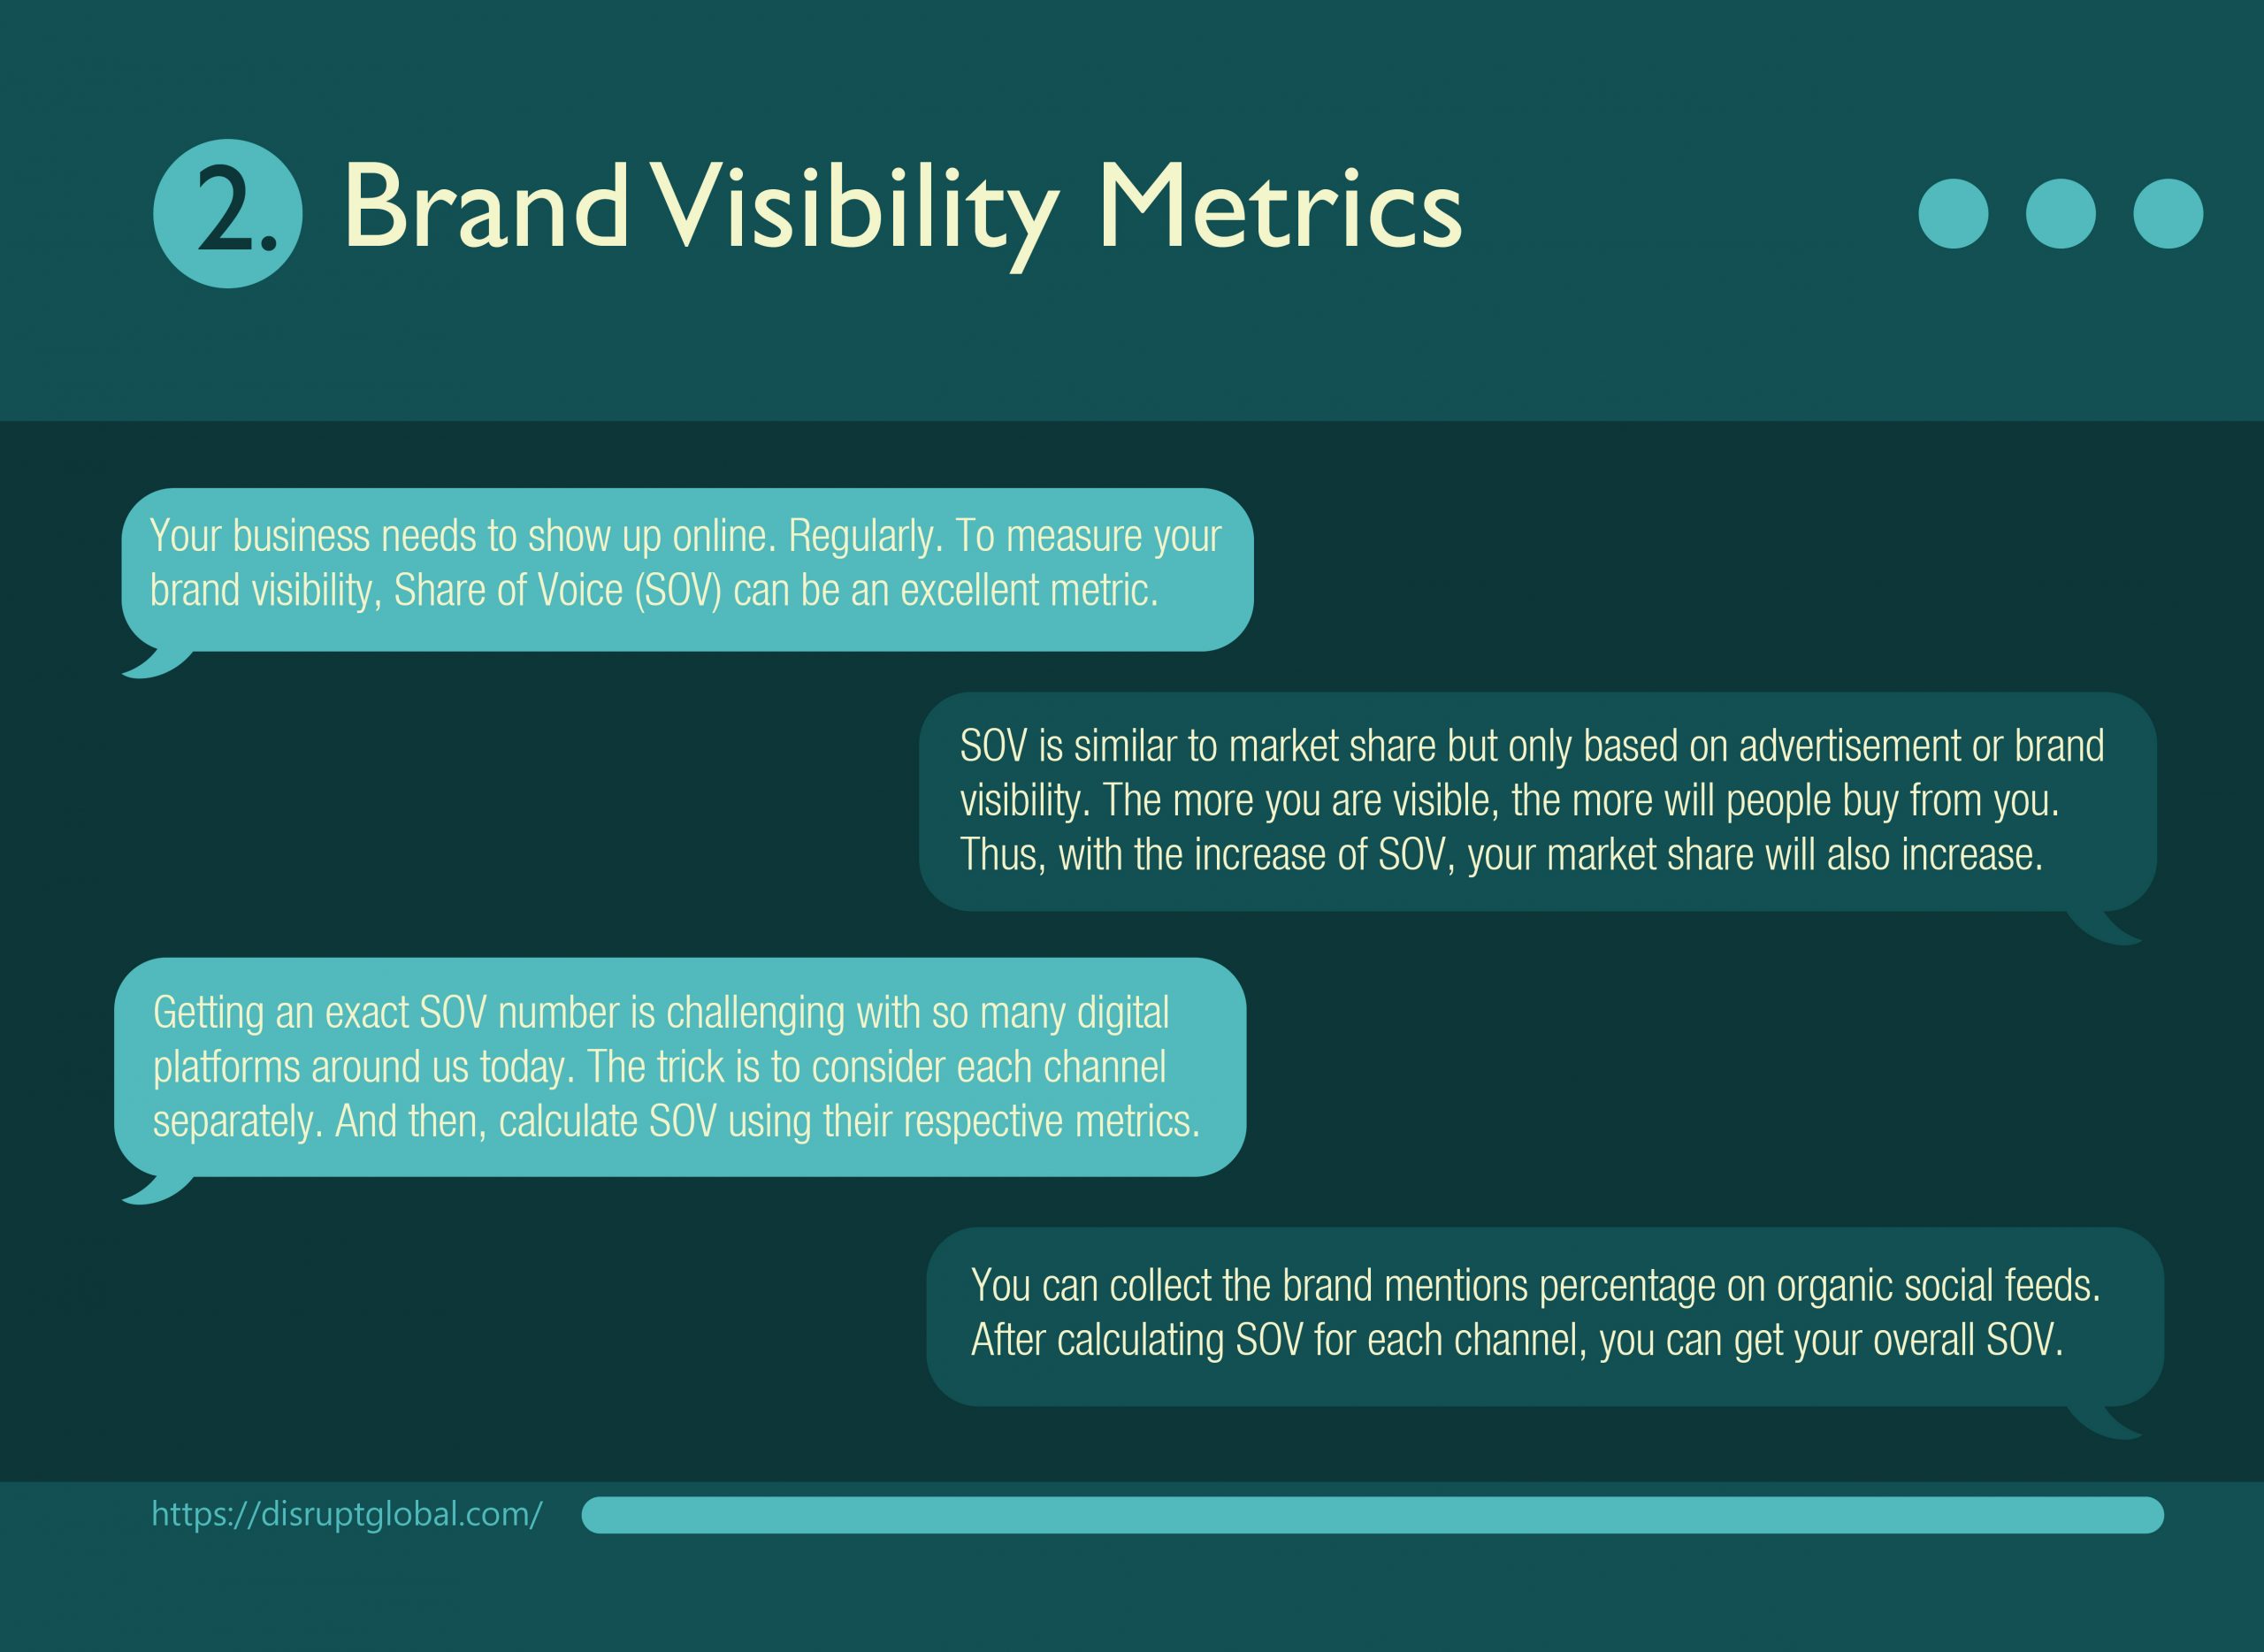
Your business needs to show up online. Regularly. To measure your brand visibility, Share of Voice (SOV) can be an excellent metric.
SOV is similar to market share but only based on advertisement or brand visibility. The more you are visible, the more will people buy from you. Thus, with the increase of SOV, your market share will also increase.
Getting an exact SOV number is challenging with so many digital platforms around us today. The trick is to consider each channel separately. And then, calculate SOV using their respective metrics.
For instance, you can get your organic search visibility in Google. You can collect the brand mentions percentage on organic social feeds. After calculating SOV for each channel, you can get your overall SOV.
3. Customer Acquisition Metrics
Every business wants to bring new customers in. But at what cost? Customer Acquisition Cost (CAC) is a metric that has been used by both businesses and investors.
In this online marketing era, you can track the whole customer journey and follow their decision-making process. CAC shows at what cost you are converting an individual prospect.
Measuring your CAC is simple. You just have to measure and add up all your costs. For example, production cost, technical cost, advertising cost, etc. And then, divide the cost by the number of customer acquisitions during that period.
Besides, there are other powerful metrics as well that you need to measure. Customer Lifetime Value (CLTV) and Churn Rate are two of them that you must not ignore.
4. Sales Performance Metrics
Again, there is an overwhelming number of sales metrics. But the general guideline is, if you only care about growth, then you should select revenue metrics like MRR (Monthly Recurring Revenue) or ARR (Annual Recurring Revenue).
But chances are you are not one of them, and you care about your costs too. Then, profit-based metrics like ROIs (Return on investment), Gross Margins will make the most sense for you.
All these sales performance metrics are easily trackable from your CRM. If you are an E-Commerce, then you should also leverage web analytics platforms like Google Analytics or Adobe Analytics.

5. User Satisfaction Metrics
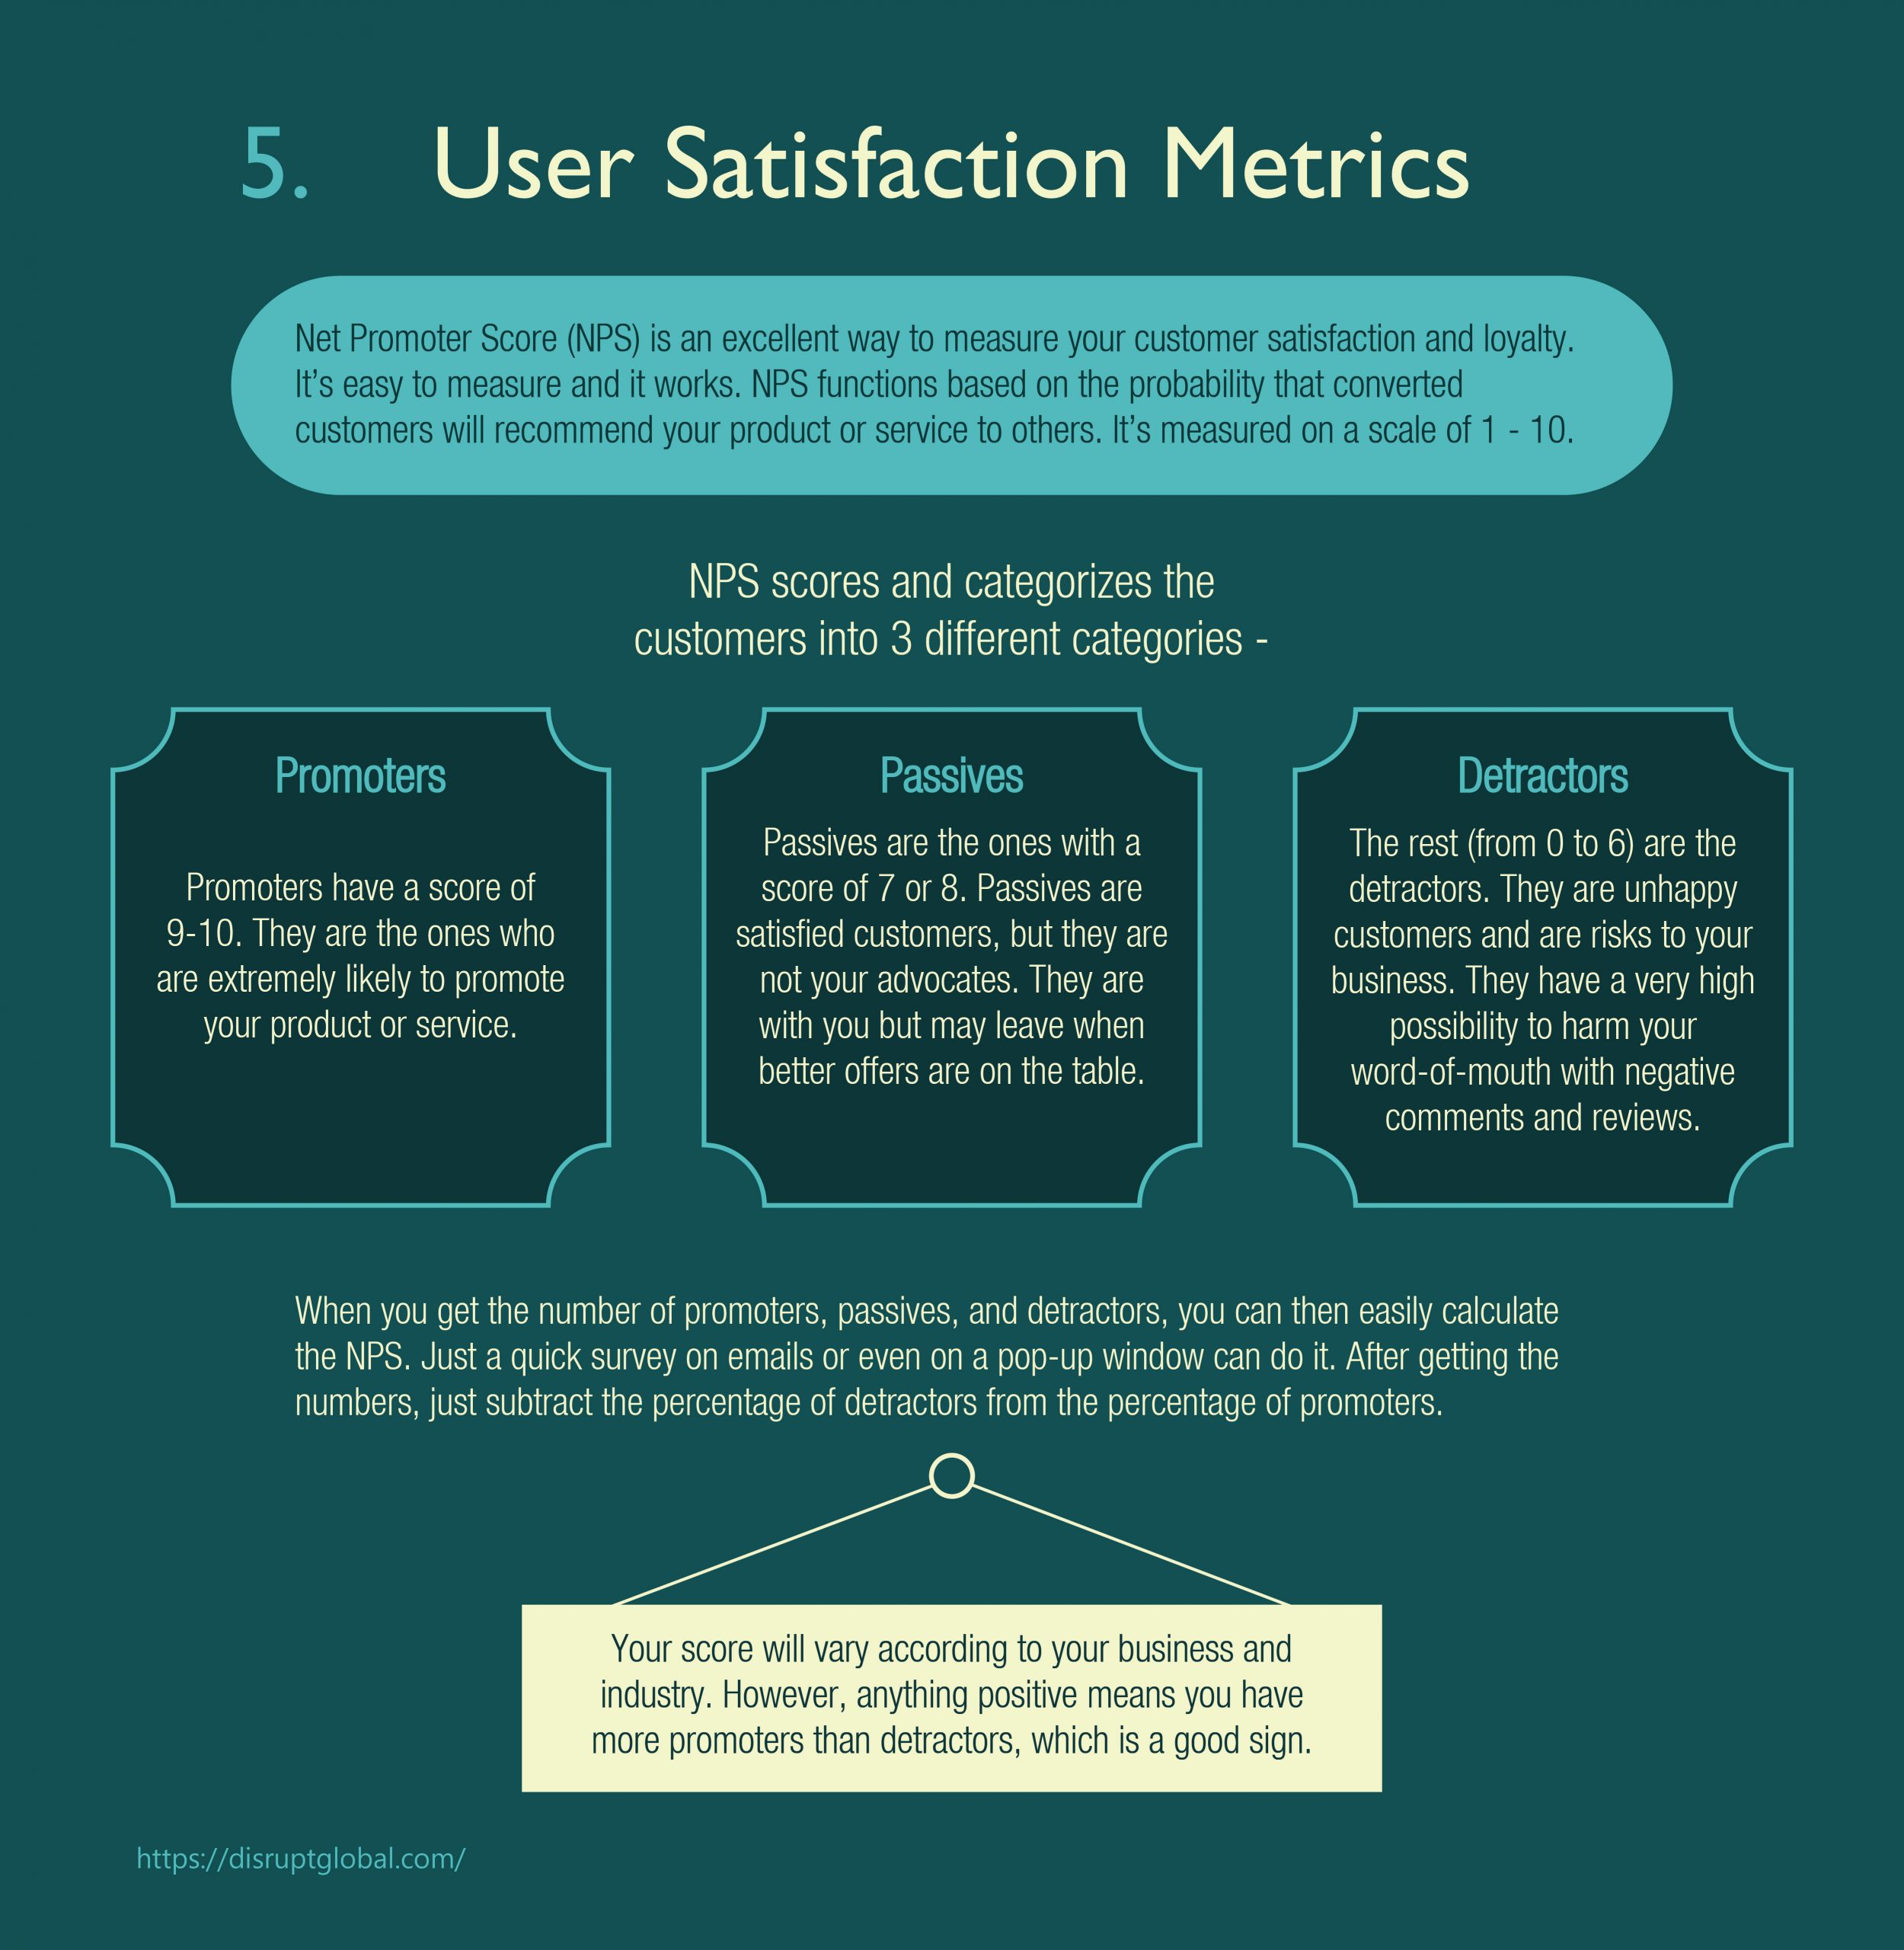
Net Promoter Score (NPS) is an excellent way to measure your customer satisfaction and loyalty. It’s easy to measure and it works.
NPS functions based on the probability that converted customers will recommend your product or service to others. It’s measured on a scale of 1 – 10.
NPS scores and categorizes the customers into 3 different categories –
• Promoters: Promoters have a score of 9-10. They are the ones who are extremely likely to promote your product or service.
• Passives: Passives are the ones with a score of 7 or 8. Passives are satisfied customers, but they are not your advocates. They are with you but may leave when better offers are on the table.
• Detractors: The rest (from 0 to 6) are the detractors. They are unhappy customers and are risks to your business. They have a very high possibility to harm your word-of-mouth with negative comments and reviews.
When you get the number of promoters, passives, and detractors, you can then easily calculate the NPS. Now the question is, how can you get the numbers?
NPS surveys! Just a quick survey on emails or even on a pop-up window can do it. After getting the numbers, just subtract the percentage of detractors from the percentage of promoters. Thus, NPS can is ranged from ‑100 and 100.
Remember, your score will vary according to your business and industry. However, anything positive means you have more promoters than detractors, which is a good sign.
Be Careful
While measuring the marketing metrics, always keep your goals in mind. If you can’t get actionable insights, all this data will be of no use. Easier said than done!
The best way is to define your problem, a hypothesis, and a set of strategic goals before even you start analyzing the metrics. Not to mention, these analysis goals should match your business goals.
Another thing to bear in mind is that you should never jump to any conclusion before asking the right questions. Disaggregate your data and ask WHY. Correlation and causation often get mixed up.
The Closing
Data has multiple dimensions. From one perspective, it can give you one insight and from another, it can tell you a whole different story. As an analyst, you need to have different lenses and scrutinize these data with contrasting POVs. Otherwise, you may head into a false trail.